In today’s post, we’ll delve into the electrical activity of the heart, focusing on how it contracts and relaxes, generating signals known as electrocardiograms (ECGs). By interpreting ECG signals, we can understand heart function and identify potential health issues. We’ll explore how to use the AD8232 sensor module to measure heart activity and visualize the ECG graph.
What is an ECG?
An electrocardiogram (ECG or EKG) is a recording of the electrical signals produced by the heart. It is used to determine heart rate, rhythm, and other critical information about heart activity. The ECG graph consists of various components that correspond to specific cardiac events:
- P wave: Represents atrial contraction.
- QRS complex: Indicates ventricular depolarization and contraction. It includes:
- Q wave: Initial downward deflection.
- R wave: Large upward deflection.
- S wave: Downward deflection following the R wave.
- T wave: Represents ventricular repolarization.
Using the AD8232 Sensor Module
The AD8232 sensor module is designed to measure heart activity. Here’s a step-by-step guide on how to use it:
Components and Setup
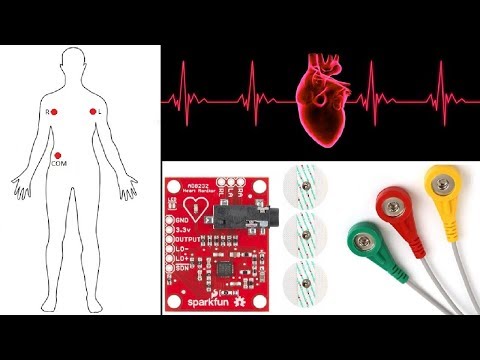
- AD8232 Sensor Module: Purchased from Amazon, this module comes with a set of electrodes and a 3.5mm connecting rod.
- Pins on AD8232: The module has nine pins, but we will use the following:
- GND: Ground
- 3.3V: Power supply
- OUTPUT: Signal output
- LO-: Leads-off detection negative
- LO+: Leads-off detection positive
- Electrodes: The module includes three electrodes that attach to specific body parts (e.g., arms, chest) using adhesive gel.
Wiring the Module
- Connect GND to the ground pin on your microcontroller.
- Connect 3.3V to the 3.3V power supply pin.
- Connect OUTPUT to an analog input pin (e.g., A0).
- Connect LO- to a digital pin (e.g., D11).
- Connect LO+ to another digital pin (e.g., D10).
Placing the Electrodes
The electrodes should be placed as follows:
- Red electrode: Right side of the chest.
- Green electrode: Left side of the body, below the heart.
- Yellow electrode: On the lower torso, around the liver area.
Alternatively, you can place the electrodes on your arms and legs.
Uploading the Code
Here’s a simple code snippet for reading the ECG signal using an Arduino:
void setup() {
  Serial.begin(9600);
  pinMode(10, INPUT);
  pinMode(11, INPUT);
}

void loop() {
  int ecgValue = analogRead(A0);
  Serial.println(ecgValue);
  delay(1);
}- Upload the code to your Arduino.
- Open the serial plotter in the Arduino IDE to visualize the ECG graph.
Visualizing the ECG
You can view the ECG graph on the Arduino serial plotter or use an oscilloscope for a more detailed analysis. Additionally, the data can be processed using software like Processing IDE for better visualization. A link to the Processing code is provided in the description for those interested.
Conclusion
Using the AD8232 sensor module, you can easily measure and visualize ECG signals, helping you understand heart activity and detect potential health issues. By following this guide, you can set up the sensor, connect it to an Arduino, and start analyzing ECG data.
For more detailed information and the Processing code, check the links provided. Happy experimenting with your heart health monitoring project!